
Macroeconomics Chapter 7: Policy Objectives - Inflation
This chapter explores the concept of inflation, and the policy objective of low and stable inflation.

Inflation
Inflation is defined as an increase in the overall level of prices in an economy over time. More precisely, inflation refers to the rate of change of the average price level rather than to a one-off rise in the price of a single good or service. When inflation occurs, money loses some of its purchasing power, meaning that the same amount of income can buy fewer goods and services than before. Inflation is therefore concerned with how prices move across the economy as a whole, not with isolated price changes.
It is important to distinguish carefully between the price level and inflation. The price level refers to the average level of prices at a particular point in time, while inflation measures how quickly that average level is changing. An economy can have a high price level but low inflation if prices are high but relatively stable. Conversely, an economy can have a low price level but high inflation if prices are rising rapidly. Inflation is therefore a dynamic concept, focused on change over time rather than absolute levels.
Inflation matters because prices play a central role in a market economy. Prices act as signals, guiding decisions made by consumers, firms, and governments. Consumers use prices to decide what to buy and how much to consume. Firms use prices to decide what to produce, how to allocate resources, and whether investment projects are likely to be profitable. When inflation is low and stable, prices provide relatively clear information about scarcity and relative value. When inflation is high or unpredictable, those signals become distorted.
Governments and central banks have therefore treated inflation as one of the key indicators of macroeconomic performance. Although economic growth may be regarded as a fundamental long-term objective, controlling inflation has often received greater attention in practice. This is because high and volatile inflation is believed to undermine economic stability and to discourage investment. Firms planning investment projects must form expectations about future costs and revenues. If inflation is unpredictable, firms may be uncertain about future prices, wages, and interest rates, making them more reluctant to commit to long-term investment. This can slow the growth of productive capacity and reduce long-run economic growth.
Inflation is also important because it affects income distribution. Inflation does not affect all individuals equally. Those with fixed incomes, such as some pensioners or workers on long-term contracts, may find that the real value of their income falls as prices rise. By contrast, individuals whose incomes adjust quickly with inflation may be less affected. Inflation can therefore redistribute real income between different groups in society, even if average income remains unchanged.
From a policy perspective, inflation is rarely regarded as desirable when it is high or volatile. However, it is also important to note that most governments do not aim for zero inflation. A small, positive rate of inflation is often considered acceptable or even beneficial, as it allows relative prices to adjust more easily and reduces the risk of deflation. The objective of policy is therefore typically described as low and stable inflation rather than the complete absence of price increases.
In order to monitor inflation, governments require a systematic way of measuring changes in the general price level. Because there is no single “average price” in an economy, inflation cannot be observed directly. Instead, it must be estimated using statistical measures that track the prices of a wide range of goods and services over time. This leads directly to the use of index numbers, which provide a method for comparing prices at different points in time relative to a chosen base period.
Index Numbers
In order to measure inflation, it is first necessary to establish a way of comparing prices over time. This presents an immediate problem, because an economy contains millions of different prices that change at different rates. There is no single, observable “average price” that can be tracked directly. The solution to this problem is to use index numbers, which provide a systematic method of comparing the value of a variable at different points in time relative to a chosen reference point.
An index number expresses the value of a variable in one period relative to its value in a base period. The base period is assigned an index value of 100, and values in other periods are measured relative to this benchmark. If the index rises above 100, this indicates that the value of the variable has increased relative to the base period. If the index falls below 100, this indicates that the value has decreased.
Index numbers are particularly useful for measuring changes in prices because they allow many individual price movements to be combined into a single indicator. Rather than tracking the price of one good, an index can reflect changes in the prices of a wide range of goods and services. This makes it possible to estimate changes in the general price level faced by households.
The logic of an index number can be illustrated with a simple example. Suppose the price of a particular good is used as the variable of interest. If the price in the base year is taken as the reference point and assigned a value of 100, then any change in the price in later years can be expressed relative to this base. If the price rises by half relative to the base year, the index value becomes 150. If the price falls to three quarters of its base-year level, the index value becomes 75. The index therefore shows proportional changes rather than absolute changes in prices.
The advantage of using index numbers is that they make it possible to compare changes over time even when prices are measured in different units or currencies. Index numbers remove the need to focus on absolute price levels and instead highlight relative movements. This is particularly important when comparing price changes across different goods, regions, or time periods.
When index numbers are used to measure prices, they are often interpreted as indicators of the cost of living. A price index can be thought of as showing how the cost of purchasing a representative bundle of goods and services changes over time. If the index rises, the cost of that bundle has increased relative to the base period. If the index falls, the cost of the bundle has decreased.
However, it is important to recognise that index numbers are a simplification of reality. They depend on the choice of base period and on the items included in the index. The base year is usually chosen to be a recent year that is regarded as typical or stable, but no base year is entirely neutral. Over time, consumption patterns change, and a basket of goods that was representative in the base year may become less representative in later years.
Despite these limitations, index numbers provide an essential tool for measuring inflation. Without them, it would be impossible to summarise changes in thousands of individual prices in a meaningful way. Index numbers therefore form the foundation of all official measures of inflation and are central to the analysis of price stability and macroeconomic performance.
Creating an Index Number
Once the idea of an index number has been established, the next step is to understand how an index number is actually calculated. Creating an index number involves comparing the value of a variable in a given period with its value in a chosen base period and expressing that comparison in a standardised form. This allows changes over time to be measured clearly and consistently.
The starting point is the selection of a base period. The base period is assigned an index value of 100 by convention. This does not imply anything special about prices in that year other than that it serves as a reference point. All subsequent index values show how prices in later periods compare with prices in the base period.
To calculate the index number for a later period, the value of the variable in that period is divided by its value in the base period. The result is then multiplied by 100. This converts the ratio into an index value that can be easily interpreted. If the index value is greater than 100, the variable has increased relative to the base period. If it is less than 100, the variable has decreased.
For example, suppose the price of a good in the base year is 1.20 and the price in the current year is 1.80. Dividing the current price by the base price gives 1.50. Multiplying by 100 produces an index value of 150. This means that the price is 50 percent higher than in the base year. The index number therefore summarises the proportional change in price in a simple numerical form.
Index numbers can also be used to calculate percentage changes between periods. The percentage change in the variable between the base year and the current year can be found by subtracting 100 from the index value. In the previous example, an index of 150 implies a 50 percent increase in price relative to the base year. If the index were 95, this would imply that the price is 5 percent lower than in the base year.
Although this example refers to a single price, the same principle applies when index numbers are used to measure changes in the general price level. In that case, the variable being compared is not a single price but the cost of a basket of goods and services. The cost of that basket in the base year is assigned a value of 100, and the cost in later years is compared with it using the same method.
Index numbers are particularly useful because they allow changes to be expressed in relative terms. Absolute price changes can be misleading, especially when comparing goods with very different prices. A rise of one dollar in the price of a low-cost item represents a much larger proportional change than the same increase in the price of an expensive item. Index numbers avoid this problem by focusing on ratios rather than absolute differences.
It is important to remember that index numbers show how values change relative to the base period, not between any two adjacent periods unless those periods are compared explicitly. To calculate inflation over time, economists usually compare index values across consecutive periods and calculate the percentage change from one period to the next. This process allows the rate of inflation to be estimated from movements in the price index.
Creating an index number is therefore a straightforward but powerful technique. It provides the foundation for measuring inflation and for analysing changes in prices over time. Once an index has been constructed, it can be used to calculate inflation rates, compare price changes across periods, and assess how the cost of living evolves.
The Consumer Price Index and Inflation in the United States
The consumer price index is the most widely used measure of inflation in the United States and is designed to estimate changes in the general level of prices faced by households. It measures how the cost of purchasing a representative basket of goods and services changes over time. By tracking movements in this index, economists and policymakers can estimate the rate at which the cost of living is rising or falling.
In the United States, the consumer price index is produced by the Bureau of Labor Statistics. The construction of the index begins with the identification of a representative basket of goods and services that reflects typical spending patterns of urban consumers. This basket includes a wide range of items, such as food, clothing, transportation, housing-related expenses, healthcare, education, and recreational goods and services. The objective is not to capture every purchase made by every household, but to approximate average consumption as closely as possible for the population covered by the index.
Each item in the basket is assigned a weight that reflects its importance in total household expenditure. Goods and services that account for a larger share of household spending are given greater weight in the index. For example, housing-related costs, including rent and owners’ equivalent rent, make up a substantial proportion of consumer spending in the United States. As a result, price changes in housing have a significant influence on movements in the overall index. By contrast, items that represent a smaller share of expenditure have a more limited effect on the measured inflation rate.
Prices for the items in the basket are collected at regular intervals from a large sample of retail outlets, service providers, and housing units across different geographic areas. These prices are recorded over time and combined using the assigned weights to calculate the overall index value for each period. The result is an index number that shows how the cost of purchasing the representative basket has changed relative to a chosen base period.
The consumer price index measures the level of prices, not inflation itself. Inflation is calculated from the index by measuring the percentage change in the index over time. In the United States, inflation is most commonly reported as the percentage change in the index compared with the same month one year earlier. This twelve-month comparison helps to smooth out short-term fluctuations and seasonal effects, providing a clearer indication of underlying inflationary trends.
It is important to recognise that the consumer price index is an estimate rather than a precise measure of the cost of living experienced by every household. Individual households have different spending patterns, and price changes affect them differently. For example, households that spend a larger share of their income on energy or food may experience higher inflation than suggested by the index when prices in these categories rise sharply. Conversely, households that spend more on goods and services with stable prices may experience lower inflation.
The consumer price index also faces challenges arising from changes in consumption patterns over time. As technology evolves, incomes change, and consumer preferences shift, households alter what they buy. To ensure that the index remains representative, the Bureau of Labor Statistics updates the basket of goods and services and the associated weights periodically. Without these updates, the index would become increasingly disconnected from actual consumer spending behaviour.
Despite these limitations, the consumer price index remains a central tool for economic analysis in the United States. It provides a consistent and transparent method of tracking changes in the general price level and is widely used to assess inflation, adjust wages and benefits, and guide monetary policy decisions. By summarising complex price data into a single index, it allows changes in the cost of living to be monitored and compared over time.
Alternative Measurements of Inflation
Although the consumer price index is the most widely used measure of inflation, it is not the only way of measuring changes in the general price level. Different price indices exist because no single index can capture all aspects of inflation experienced across an economy. Alternative measures differ in terms of the goods and services included, the population covered, and the methods used to calculate price changes. As a result, different indices may show different rates of inflation at the same time.
One alternative measure of inflation is based on a broader range of prices than those faced directly by households. Some price indices include prices paid by firms for inputs used in production rather than prices paid by consumers. These producer-focused indices are useful for analysing cost pressures faced by firms and for identifying potential future inflation. Rising input prices may eventually be passed on to consumers in the form of higher prices, but this transmission is neither immediate nor guaranteed.
Another source of variation between inflation measures arises from differences in population coverage. The consumer price index is designed to reflect the spending patterns of a typical household, but it may exclude certain groups. For example, some indices exclude households with very high incomes or those primarily dependent on benefits or pensions. As a result, alternative indices may be developed to reflect the price experiences of specific groups more accurately.
There are also differences in how housing costs are treated. Housing represents a significant share of household expenditure, but measuring changes in housing costs is complex. Some inflation measures include owner-occupied housing costs directly, while others exclude them or use indirect methods. These differences can lead to substantial divergences between inflation rates, particularly during periods of rapid change in house prices or mortgage interest rates.
The method used to calculate the index can also affect measured inflation. Some indices use arithmetic averages to combine price changes, while others use geometric averages. These different approaches reflect alternative assumptions about how consumers respond to changes in relative prices. For example, if the price of one good rises sharply, consumers may substitute away from it toward cheaper alternatives. Indices that account for substitution tend to show lower inflation than those that do not.
Alternative inflation measures are therefore not simply competing statistics, but tools designed for different purposes. Policymakers, analysts, and economists often examine several inflation indicators to gain a more complete understanding of price pressures in the economy. A single index may fail to capture important developments in particular sectors or for specific groups.
The existence of multiple inflation measures highlights the inherent difficulty of summarising complex price movements in a single number. Inflation is not experienced uniformly across the economy, and different measures can legitimately produce different results. Understanding how and why inflation measures differ is essential for interpreting inflation data accurately and for assessing the implications of inflation for economic policy.
Inflation Rates Over Time
Once a price index has been constructed, it can be used to analyse how inflation behaves over time. Inflation rates are derived from movements in the price index and show how quickly the general price level is rising or falling. Examining inflation rates over time allows economists to identify patterns, assess stability, and evaluate the effectiveness of economic policy.
The inflation rate is calculated as the percentage change in the price index between two periods. Most commonly, inflation is measured on a twelve-month basis. This involves comparing the value of the index in a given month with its value in the same month one year earlier. Using a twelve-month comparison helps to remove seasonal effects, such as regular changes in food or clothing prices, and provides a clearer picture of underlying inflationary pressures.
Inflation rates can vary considerably from one period to another. Short-term fluctuations may be caused by temporary factors such as changes in energy prices, indirect taxes, or exchange rates. For example, a sharp increase in oil prices may cause a temporary spike in inflation, even if underlying demand conditions in the economy remain unchanged. These short-run movements do not necessarily indicate a sustained inflationary problem.
Because of this volatility, economists often focus on trends in inflation rather than month-to-month changes. By examining inflation rates over longer periods, it is possible to identify whether inflation is generally rising, falling, or remaining stable. A period of consistently low and stable inflation is usually interpreted as evidence that the economy is operating in a relatively balanced way, with aggregate demand broadly in line with productive capacity.
Historical data show that inflation has not always been stable. In many economies, inflation was relatively high and volatile during the 1970s and early 1980s. During this period, inflation rates frequently reached double digits, reflecting a combination of strong demand pressures and rising production costs. Since then, many countries have experienced lower and more stable inflation, particularly following the adoption of explicit inflation targets by central banks.
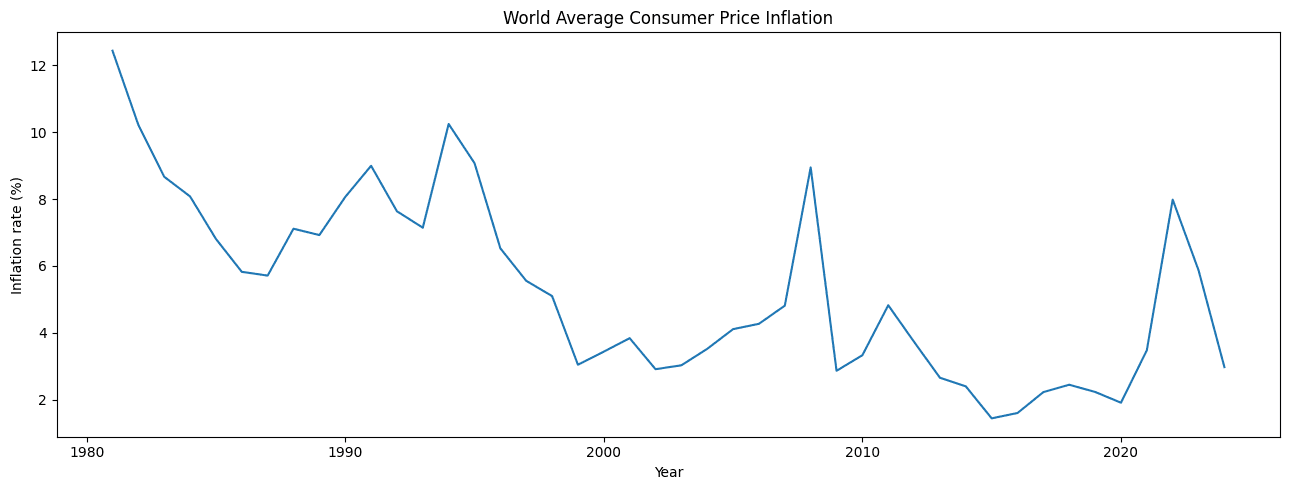
Inflation rates can also differ depending on which index is used. As discussed earlier, the consumer price index and the retail price index may show different inflation rates in the same period. When interpreting inflation data over time, it is therefore important to compare like with like. A fall in CPI inflation does not necessarily imply that all measures of inflation are falling at the same rate.
Periods of very low inflation may also raise concerns. If inflation falls close to zero, the economy may be at risk of deflation. Deflation involves a sustained fall in the general price level and can have damaging effects on output and employment. For this reason, policymakers often view moderate positive inflation as preferable to very low or negative inflation.
Analysing inflation rates over time provides valuable insight into the performance of the economy. It helps to identify periods of instability, to assess the impact of economic shocks, and to judge whether policy has succeeded in maintaining price stability. Inflation data therefore play a central role in macroeconomic analysis and policy evaluation.
Deflation and Disinflation
Inflation analysis must also consider situations in which inflation falls or becomes negative. Two terms are often used in this context, deflation and disinflation. Although they sound similar, they describe very different economic conditions, and confusing them can lead to serious misunderstandings about what is happening in an economy.
Deflation refers to a sustained fall in the general price level over time. Under deflation, the average level of prices across the economy is declining, meaning that money gains purchasing power. Goods and services become cheaper on average, not just in isolated markets but across the economy as a whole. Deflation is therefore the opposite of inflation, in the sense that the price index is falling rather than rising.
Disinflation, by contrast, refers to a fall in the rate of inflation. Prices are still rising under disinflation, but they are rising more slowly than before. For example, if inflation falls from 5 percent to 2 percent, the economy is experiencing disinflation, not deflation. The price level continues to increase, but at a reduced rate.
The distinction between deflation and disinflation is crucial. Disinflation is often regarded as a normal or even desirable outcome of successful economic policy, particularly if inflation had previously been high. Reducing inflation can restore price stability and improve the clarity of price signals without reversing the overall upward trend in the price level.
Deflation, however, is generally viewed as harmful. When prices are expected to fall, households and firms may postpone spending in anticipation of lower prices in the future. If consumers delay purchases and firms delay investment, aggregate demand may weaken. Lower demand reduces firms’ revenues, which can lead to cuts in output and employment. As unemployment rises, income falls further, reinforcing the decline in demand. In this way, deflation can contribute to a self-reinforcing downward spiral in economic activity.
Deflation also increases the real burden of debt. Debts are usually fixed in nominal terms. When prices fall, the real value of outstanding debt rises, making it harder for households and firms to service their loans. This can lead to higher default rates, financial instability, and further reductions in spending. These effects make deflation particularly difficult to reverse once it becomes established.
Disinflation does not have these effects. Under disinflation, prices continue to rise, so there is no incentive to delay spending in anticipation of falling prices. The real value of debt does not increase in the same way, and the risks associated with deflation are avoided. For this reason, policymakers generally aim to achieve disinflation when inflation is too high, rather than allowing inflation to turn negative.
Understanding the difference between deflation and disinflation is essential for interpreting inflation data. A falling inflation rate does not necessarily indicate economic weakness. It may reflect improved policy credibility, lower cost pressures, or stabilisation following a period of high inflation. Only when the price level itself begins to fall does deflation occur, bringing with it a distinct set of economic risks.
Hyperinflation
Hyperinflation refers to an extreme and uncontrolled increase in the general price level. It is not simply a case of high inflation. Hyperinflation occurs when prices rise at extraordinarily rapid rates, often measured in hundreds or thousands of percent per year. In such conditions, money loses its ability to function effectively as a medium of exchange, a store of value, and a unit of account.
There is no single universally accepted numerical threshold for hyperinflation, but it is commonly defined as inflation that exceeds 50 percent per month. At this rate, prices double in a matter of weeks. The defining feature of hyperinflation is therefore not just the size of price increases, but their speed and persistence. Once hyperinflation takes hold, price increases accelerate rapidly as confidence in the currency collapses.
Hyperinflation fundamentally disrupts the functioning of the economy. As prices rise extremely quickly, money loses its purchasing power almost immediately. Households and firms try to spend money as soon as they receive it, because holding cash even for a short period results in a loss of real value. This behaviour increases the velocity of circulation of money, which further fuels price rises and intensifies inflationary pressure.
The price system ceases to provide reliable signals. When prices change daily or even hourly, firms struggle to set prices, calculate costs, or plan production. Accounting becomes difficult, contracts lose meaning, and long-term planning becomes almost impossible. The role of money as a unit of account breaks down, as prices quoted in the local currency become unstable and meaningless.
Hyperinflation also has severe distributional effects. Individuals on fixed nominal incomes, such as pensioners and wage earners whose pay does not adjust immediately, experience a dramatic fall in real income. Savings held in cash or fixed-value financial assets are rapidly wiped out. By contrast, those who hold real assets or who can adjust prices and wages quickly may be better protected. As a result, hyperinflation redistributes income and wealth in arbitrary and often socially destabilising ways.
International trade is also disrupted. As the domestic currency loses value, foreign suppliers may refuse to accept it, and imports become extremely expensive. Shortages of essential goods may emerge as firms struggle to obtain inputs from abroad. In some cases, alternative currencies or barter systems begin to replace the official currency as people seek more stable means of exchange.
Hyperinflation is typically associated with a collapse in confidence in government economic management. It often arises when governments finance large budget deficits by creating money, particularly in situations where tax revenues have collapsed and access to borrowing is limited. Once inflation expectations become unanchored, attempts to control inflation become increasingly difficult.
Ending hyperinflation usually requires drastic policy measures. These may include sharp reductions in government spending, reforms to restore fiscal credibility, and the introduction of a new currency or monetary regime. Such measures often involve significant short-term economic hardship, but they are necessary to restore price stability and confidence.
Hyperinflation therefore represents one of the most damaging forms of macroeconomic instability. Unlike moderate inflation, which can sometimes be managed and contained, hyperinflation undermines the basic institutions of a monetary economy. Its effects extend beyond economics, often contributing to political instability and social unrest.
Causes of Inflation
Inflation does not arise randomly. Persistent increases in the general price level reflect underlying forces operating within the economy. Understanding the causes of inflation is essential for explaining why inflation occurs, why it sometimes accelerates, and why controlling inflation can be difficult. At the most basic level, inflation results when there is sustained upward pressure on prices across a wide range of markets rather than isolated price increases in individual goods or services.
It is important to distinguish between a one-off rise in the price level and ongoing inflation. A single increase in the price of oil, for example, may raise the overall price level temporarily, but it does not by itself constitute inflation unless it leads to continuing price increases over time. Inflation refers to a continuing process in which prices keep rising period after period. The causes of inflation must therefore be capable of generating persistent pressure on prices rather than temporary shocks.
Economists typically group the causes of inflation into two broad categories. One group of explanations focuses on excess demand in the economy, while the other focuses on rising costs of production. These two approaches are known respectively as demand-pull inflation and cost-push inflation. Although they are analytically distinct, they can interact in practice, reinforcing each other over time.
Before examining these causes in detail, it is helpful to consider the role of aggregate demand and aggregate supply. The general price level is determined by the interaction between total demand for goods and services and the economy’s productive capacity. When aggregate demand grows faster than aggregate supply, firms respond by raising prices rather than expanding output indefinitely. When costs of production rise across the economy, firms may raise prices in order to maintain profitability, even if demand has not increased.
Inflation may also be influenced by expectations. If households and firms expect prices to rise in the future, they may change their behaviour in ways that contribute to inflation in the present. Workers may demand higher wages to protect their real incomes, and firms may raise prices in anticipation of higher costs. In this way, inflation can become self-reinforcing once expectations adjust.
Another key distinction is between inflation driven by real factors and inflation driven by monetary factors. Real factors include changes in demand, productivity, and costs of production. Monetary factors relate to the growth of the money supply and the availability of credit. While real factors may trigger price increases, sustained inflation over long periods is often associated with excessive growth of the money supply relative to the growth of output.
The causes of inflation therefore operate through multiple channels. Some causes generate immediate upward pressure on prices, while others affect inflation more gradually through expectations and institutional mechanisms. To analyse inflation effectively, it is necessary to consider both the initial source of price pressure and the processes through which that pressure is transmitted and sustained.
The next sections examine the two main explanations of inflation in detail. The first focuses on inflation caused by rising production costs, while the second examines inflation caused by excess aggregate demand. Each explanation will be analysed step by step, using clear reasoning and diagrammatic analysis to show how inflationary pressure emerges.
Cost-Push Inflation
Cost-push inflation occurs when the general price level rises because the costs of production increase across the economy. In this case, inflation is driven not by excess demand, but by higher costs faced by firms. When firms experience an increase in production costs, they may respond by raising prices in order to maintain profit margins. If cost increases are widespread and persistent, this leads to sustained upward pressure on the general price level.
The key idea behind cost-push inflation is that firms set prices with reference to their costs of production. These costs include wages paid to labour, prices of raw materials, energy costs, and other inputs required for production. When these costs rise, firms face a squeeze on profitability if prices remain unchanged. In order to protect profits, firms may raise prices, contributing to inflation.
One important source of cost-push inflation is rising wages. Labour is a major factor of production, and wages represent a significant proportion of firms’ total costs. If wages rise faster than labour productivity, unit labour costs increase. Unit labour cost refers to the labour cost of producing one unit of output. When unit labour costs rise across the economy, firms are likely to pass these higher costs on to consumers in the form of higher prices.
Wage increases may occur for several reasons. Strong trade unions may negotiate higher wages, particularly in labour markets where unemployment is low. Workers may also demand higher wages in response to rising living costs, creating a feedback loop between wages and prices. If wage increases are not matched by improvements in productivity, they contribute directly to cost-push inflation.
Another major source of cost-push inflation is rising prices of raw materials and energy. Many industries rely on commodities such as oil, gas, metals, and agricultural products as inputs. If the prices of these inputs increase sharply, firms face higher production costs. Because energy is used across a wide range of industries, increases in energy prices can have economy-wide effects on costs and prices.
Cost-push inflation can be illustrated using the aggregate demand and aggregate supply framework. In this framework, cost increases are represented by a leftward shift of the short-run aggregate supply curve. The short-run aggregate supply curve shows the relationship between the general price level and the quantity of real output that firms are willing to supply, given existing costs and technology.
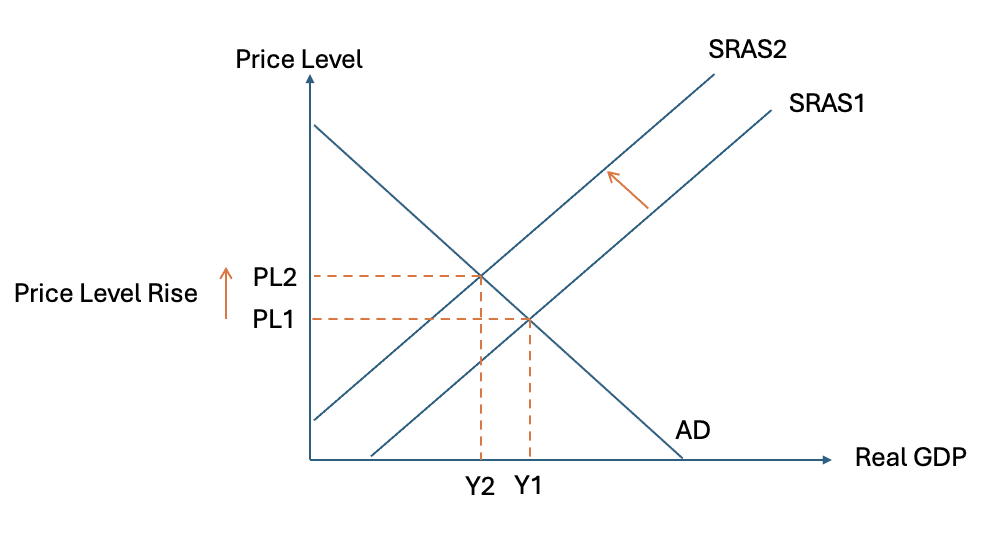
When production costs rise, firms are willing to supply less output at each price level. This causes the short-run aggregate supply curve to shift to the left. At the original level of aggregate demand, the new intersection occurs at a higher price level and a lower level of real output. The result is inflation combined with a fall in output, a situation often described as stagflation.
This outcome highlights an important feature of cost-push inflation. Unlike demand-pull inflation, cost-push inflation is associated with a trade-off between inflation and output. Prices rise while real output falls, increasing unemployment. This makes cost-push inflation particularly difficult for policymakers to address, because policies aimed at reducing inflation may further reduce output and employment.
Cost-push inflation may be triggered by one-off cost increases, such as a sudden rise in oil prices. A single cost shock may cause a one-time increase in the price level, but it does not necessarily lead to sustained inflation unless it is reinforced by other factors. Persistent cost-push inflation requires ongoing increases in costs or feedback mechanisms that cause price rises to continue over time.
One such feedback mechanism is the wage–price spiral. If higher prices lead workers to demand higher wages to maintain real incomes, and higher wages then lead firms to raise prices further, inflation can become self-sustaining. Expectations play a key role in this process. If workers and firms expect inflation to continue, their behaviour may contribute to its persistence.
Cost-push inflation therefore arises from pressures on the supply side of the economy. It reflects rising production costs rather than excessive demand. While cost-push inflation can be triggered by external shocks, such as changes in commodity prices, it can become persistent if reinforced by wage-setting behaviour and inflation expectations.
Demand-Pull Inflation
Demand-pull inflation occurs when the general price level rises because aggregate demand in the economy increases faster than the economy’s ability to produce goods and services. In this case, inflation is driven by excess demand rather than rising production costs. When total spending in the economy grows beyond the level that can be met by existing productive capacity, firms respond by raising prices rather than expanding output indefinitely.
Aggregate demand represents total planned spending on goods and services in the economy. It consists of consumption by households, investment by firms, government spending, and net exports. An increase in any of these components can raise aggregate demand. For example, rising household incomes may increase consumption, greater business confidence may stimulate investment, expansionary fiscal policy may increase government spending, or stronger global growth may raise export demand.
Demand-pull inflation is most likely to occur when the economy is operating close to full employment. When there is spare capacity in the economy, firms can respond to rising demand by increasing output without raising prices significantly. However, as the economy approaches its full employment level of output, resources such as labour and capital become increasingly scarce. Firms find it harder to expand production, and bottlenecks begin to emerge. At this point, further increases in demand tend to push up prices rather than output.
The process underlying demand-pull inflation can be explained using the aggregate demand and aggregate supply framework. In this framework, an increase in aggregate demand is shown as a rightward shift of the aggregate demand curve. This shift reflects higher planned spending at every price level.
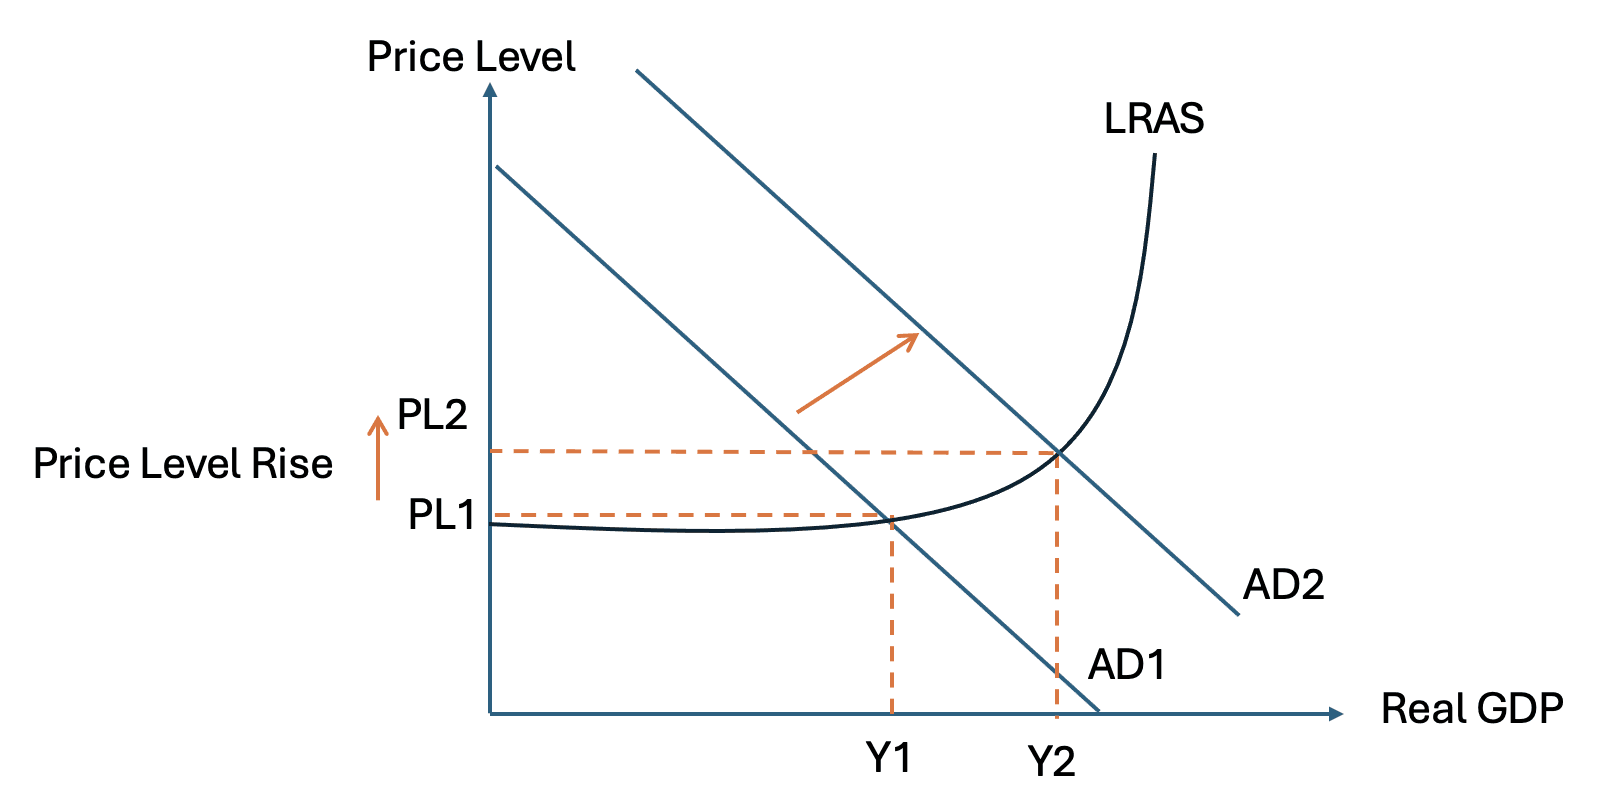
When aggregate demand shifts to the right, it intersects the short-run aggregate supply curve at a higher price level and a higher level of real output. If the economy is initially operating below full employment, output may rise with only a modest increase in prices. However, as output approaches the full employment level, the short-run aggregate supply curve becomes steeper. Firms face rising marginal costs as they compete for scarce resources, particularly labour. As a result, further increases in aggregate demand lead to larger increases in prices and smaller increases in output.
At full employment, the economy is producing at its maximum sustainable level given current resources and technology. Any attempt to push output beyond this level leads primarily to inflation. Real output cannot increase further in a sustained way, so excess demand is absorbed through rising prices. Demand-pull inflation therefore reflects an economy overheating, where spending is growing faster than productive capacity.
Demand-pull inflation is often associated with periods of strong economic growth. During booms, rising incomes, high confidence, and expansionary policy may combine to push demand beyond sustainable levels. While such periods may be characterised by low unemployment and rising output initially, persistent excess demand eventually leads to inflationary pressure.
Unlike cost-push inflation, demand-pull inflation does not involve a fall in output. Instead, it reflects upward pressure on prices as the economy operates at or near full capacity. This difference is important for policy. Demand-pull inflation can often be addressed by policies that reduce aggregate demand, such as tighter monetary policy or contractionary fiscal policy. By reducing spending growth, policymakers can ease inflationary pressure without necessarily causing a sharp fall in output if action is taken early.
Expectations again play an important role. If households and firms expect inflation to rise, they may increase spending in anticipation of higher future prices, further boosting demand. This behaviour can reinforce demand-pull inflation and make it more difficult to control.
Demand-pull inflation therefore arises from the demand side of the economy. It reflects sustained excess spending relative to productive capacity and is most likely to occur when the economy is close to full employment. Understanding demand-pull inflation is essential for analysing inflation during periods of rapid growth and for designing policies aimed at maintaining price stability.
Why There May Be Persistent Inflation
While cost-push and demand-pull factors can explain why inflation begins, they do not by themselves fully explain why inflation may persist over long periods. A one-off increase in costs or a temporary surge in demand can raise the price level, but persistent inflation requires a mechanism that allows prices to keep rising year after year. Understanding this distinction is essential for analysing why some economies experience prolonged inflationary episodes rather than isolated bursts of price increases.
Persistent inflation is closely linked to the relationship between the growth of nominal demand and the growth of real output. If nominal spending in the economy continues to rise faster than the economy’s capacity to produce goods and services, upward pressure on prices will be sustained. Over time, this imbalance leads to a continuing rise in the general price level rather than a single adjustment.
A central factor in sustaining inflation is the growth of the money supply. Money is used to facilitate transactions in the economy, and the total amount of money available influences the level of nominal spending. If the supply of money grows rapidly while the growth of real output is limited, there will be more money chasing a relatively fixed quantity of goods and services. This creates ongoing upward pressure on prices.
This relationship can be expressed in simple terms. For inflation to persist, the growth of money and credit must be accommodated by the financial system and not offset by increases in real output. If real output grows slowly, but the money supply expands quickly, the excess purchasing power generated by money growth is absorbed through rising prices. In this sense, sustained inflation is fundamentally a monetary phenomenon, even if it is initially triggered by real shocks such as cost increases or demand surges.
Expectations play a crucial role in transforming temporary inflationary pressure into persistent inflation. If households and firms expect inflation to continue, they adjust their behaviour in ways that reinforce inflation. Workers may demand higher nominal wages to protect their real incomes. Firms may raise prices in anticipation of higher future costs. Lenders may demand higher nominal interest rates to compensate for expected inflation. These responses embed inflation into wage-setting and price-setting behaviour.
Once expectations of inflation become established, inflation can become self-reinforcing. Higher wages raise firms’ costs, leading to higher prices. Higher prices reduce real wages, prompting further wage demands. This process can continue even if the original cause of inflation has faded. Inflation persistence therefore depends not only on current economic conditions but also on beliefs about future inflation.
Institutional factors can also contribute to persistent inflation. In some economies, wages, pensions, and contracts are indexed to inflation. Indexation means that nominal values are automatically adjusted in line with past inflation. While this protects real incomes in the short run, it can make inflation more difficult to reduce because price increases feed directly into future cost increases. Inflation becomes built into the structure of the economy.
Persistent inflation is also influenced by policy credibility. If economic agents believe that the authorities are unwilling or unable to control inflation, they are more likely to expect continued price rises. These expectations then shape behaviour in ways that make inflation harder to bring down. By contrast, credible commitments to low and stable inflation can anchor expectations and reduce the persistence of inflationary pressures.
The distinction between a one-off rise in the price level and persistent inflation is therefore critical. A temporary shock may raise prices once, but sustained inflation requires ongoing growth in nominal demand and accommodating monetary conditions. Controlling persistent inflation typically requires policy measures that limit money and credit growth and restore confidence that inflation will be kept under control.
Consequences of Inflation
Inflation has a wide range of economic consequences that extend beyond the simple rise in prices. Its effects depend on the rate at which prices are increasing, how predictable inflation is, and how different incomes and contracts respond to rising prices. While low and stable inflation is generally regarded as manageable, higher or unpredictable inflation creates significant economic costs.
One important consequence of inflation is increased uncertainty. When inflation is unpredictable, households and firms find it more difficult to plan for the future. Firms making investment decisions must form expectations about future costs, prices, and profits. If inflation is volatile, these expectations become less reliable. Uncertainty about future prices may cause firms to delay or cancel investment projects, reducing capital accumulation and slowing economic growth.
Inflation also affects the allocation of resources in the economy. In a market economy, prices act as signals that guide decisions about production and consumption. When inflation is high or variable, it becomes harder to distinguish changes in relative prices from changes in the general price level. Firms may misinterpret rising prices as an increase in demand for their product rather than a general inflationary trend. This can lead to inefficient investment decisions and misallocation of resources across industries.
Another important consequence of inflation is its impact on income distribution. Inflation does not affect all individuals equally. People on fixed nominal incomes, such as some pensioners or workers with long-term wage contracts, experience a fall in real income as prices rise. By contrast, individuals whose incomes adjust quickly with inflation may be less affected. Borrowers may benefit from inflation because the real value of their debt falls, while lenders lose because the real value of repayments declines. Inflation therefore redistributes real income and wealth between different groups in society, often in arbitrary ways.
Inflation can also affect savings behaviour. If inflation is high, the real value of money held as cash or in low-interest savings accounts falls over time. This discourages saving in monetary form and may encourage households to seek alternative stores of value. While this may benefit some asset markets, it can reduce the availability of funds for productive investment and distort financial decisions.
There are also direct costs associated with inflation. One such cost is menu costs. Menu costs refer to the costs firms incur when they change prices. These include the expense of updating price lists, catalogues, and computer systems, as well as the administrative effort involved in communicating price changes to customers. While each individual price change may be small, frequent inflation increases the total cost of repricing across the economy.
Another commonly identified cost is shoe-leather costs. Shoe-leather costs arise because households and firms try to minimise their holdings of cash when inflation is high, since cash loses value over time. This leads to more frequent trips to banks or more active management of financial balances. Although modern electronic banking has reduced the physical inconvenience associated with these activities, the underlying cost in terms of time and resources still exists.
Inflation can also interact with the tax system in ways that distort economic behaviour. If taxes are levied on nominal incomes rather than real incomes, inflation can push individuals into higher tax brackets even if their real purchasing power has not increased. This phenomenon, sometimes described as fiscal drag, can increase the effective tax burden and alter work and saving incentives.
The severity of these consequences depends on the rate and stability of inflation. Low and predictable inflation may have relatively modest effects, as households and firms can adjust their behaviour accordingly. High or volatile inflation, by contrast, undermines confidence in the price system and creates significant economic inefficiencies. These costs explain why controlling inflation has become a central objective of macroeconomic policy.
Inflation as a Policy Objective
Inflation control has become one of the central objectives of macroeconomic policy in most modern economies. Governments and central banks aim to achieve low and stable inflation because of the damaging effects associated with high or unpredictable price increases. The objective is not to eliminate inflation entirely, but to keep it at a rate that allows the economy to function efficiently while avoiding the risks associated with both high inflation and deflation.
One reason why low and stable inflation is preferred is that it supports clarity in price signals. When inflation is predictable and moderate, changes in relative prices are easier to interpret. Firms can distinguish between movements in overall prices and changes in demand for specific goods and services. This improves the allocation of resources and supports more efficient investment decisions. Stable inflation therefore contributes to long-term economic growth by reducing uncertainty and encouraging productive investment.
Another reason is that low inflation helps to protect the purchasing power of money. Rapid inflation erodes the real value of wages, savings, and fixed incomes. By contrast, a low and stable rate of inflation allows households to plan consumption and saving decisions with greater confidence. It also reduces arbitrary redistributions of income and wealth that can arise when inflation affects different groups unevenly.
Despite these advantages, governments do not usually aim for zero inflation. A small positive rate of inflation is often regarded as desirable. One reason is that it allows relative prices to adjust more easily. In many labour and product markets, nominal prices and wages are downwardly inflexible. Workers and firms may resist nominal wage cuts even when economic conditions change. With a small positive inflation rate, real wages and prices can adjust downward without requiring nominal cuts, reducing the risk of unemployment and output loss.
A positive inflation target also provides a buffer against deflation. As discussed earlier, deflation can be highly damaging, leading to postponed spending, rising real debt burdens, and falling output. By targeting a low but positive rate of inflation, policymakers reduce the risk that temporary shocks will push the economy into deflation. This buffer is particularly important during periods of weak demand or financial instability.
In practice, many central banks have been given responsibility for achieving inflation targets. These targets are often expressed as a specific numerical range, reflecting the idea that inflation cannot be controlled precisely at every moment. By committing to a clear inflation objective, central banks aim to anchor inflation expectations. If households and firms believe that inflation will remain low and stable, their wage-setting and price-setting behaviour is less likely to generate persistent inflationary pressure.
Inflation targeting therefore plays a key role in modern macroeconomic policy frameworks. It reflects the view that price stability is a prerequisite for sustainable economic growth and high employment. While controlling inflation may sometimes involve trade-offs with other objectives in the short run, maintaining low and stable inflation is widely regarded as essential for long-run economic stability.

Next Article
