Macroeconomics Chapter 9: Policy Objectives - Income Distribution and Social Welfare
This chapter explores the concepts of income, wealth, and welfare, as well as the policy objective of fair income distribution.
Income and Wealth
Income and wealth are related concepts, but they describe different aspects of economic well-being and must be clearly distinguished. Income refers to a flow of earnings received over a period of time, usually measured weekly, monthly, or annually. Wealth, by contrast, refers to a stock of accumulated assets held at a particular point in time. This distinction between flows and stocks is fundamental to understanding inequality and welfare.
Income consists of wages and salaries earned from employment, together with income from self-employment and other sources such as interest, dividends, rent, and profits. These earnings arise because individuals supply factors of production. Labour earns wages, land earns rent, capital earns interest or dividends, and enterprise earns profit. Income therefore reflects participation in economic activity during a given period and is closely linked to employment, skills, and productivity.
Wealth represents the total value of assets owned by an individual or household minus any outstanding liabilities. Assets may include property, savings, shares, bonds, pension entitlements, and other financial or real assets. Wealth is built up over time through saving out of income, capital gains on existing assets, and transfers such as inheritances. Because wealth is accumulated gradually, it reflects both past income and past economic conditions.
An important relationship exists between wealth and income. Ownership of wealth can generate income flows in the form of interest, dividends, rent, or profits. For example, ownership of property may generate rental income, while ownership of shares may generate dividend income. In this way, existing wealth can reinforce income differences over time. Individuals with substantial assets may receive income even without participating directly in current production, while those with little or no wealth rely primarily on wages from employment.
Income and wealth are therefore distributed differently across society. While income inequality reflects differences in earnings during a given period, wealth inequality reflects accumulated differences over many years and across generations. This helps to explain why wealth is usually much more unevenly distributed than income. A small number of households may hold a large proportion of total wealth, even if income differences appear more moderate.
Understanding the distinction between income and wealth is essential for analysing inequality and welfare. Policies that affect income, such as taxation or wage regulation, may not have the same impact on wealth distribution. Similarly, changes in asset prices can alter wealth inequality without immediately affecting income. For this reason, both income and wealth must be considered when assessing economic inequality and living standards.
The Distribution of Income and Wealth and Inequality
The distribution of income describes how total national income is shared among individuals or households within an economy. Because people differ in skills, education, productivity, asset ownership, and opportunities, income is not distributed evenly across society. Some individuals receive high levels of income, while others receive relatively little. As a result, inequality in income distribution exists in all economies.
The distribution of wealth refers to how the stock of accumulated assets is shared among the population. Wealth includes property, financial assets, savings, and other forms of ownership. Wealth distribution tends to be more unequal than income distribution because wealth is built up over time and can be transferred across generations. Individuals who inherit assets or experience sustained high incomes are able to accumulate wealth more easily than those with low or unstable incomes.
Several economic factors explain why income and wealth are distributed unevenly. Differences in labour productivity are a key source of income inequality. Workers with higher skills, greater experience, or scarce qualifications tend to earn higher wages than workers with fewer skills or lower productivity. In labour markets, wages reflect demand and supply conditions, so occupations in high demand or requiring specialist skills often command higher pay.
Ownership of wealth also contributes to inequality. Individuals who own assets receive income from those assets in addition to any earnings from employment. This income from capital, such as interest, dividends, and rent, can significantly increase total income. Over time, this can widen income gaps between those who own assets and those who do not.
Inheritance plays an important role in shaping wealth distribution. Assets passed from one generation to the next can give some individuals a significant starting advantage. Those who inherit property, savings, or financial assets begin adult life with a stock of wealth that can generate income or be used to support further investment. In contrast, individuals without inherited wealth may rely entirely on labour income.
The existence of income and wealth inequality means that individuals and groups differ in their command over resources. Some households are able to consume more goods and services, save more, and invest in education or health, while others face tighter constraints. This unequal access to resources has implications for welfare, social mobility, and economic growth.
Inequality therefore reflects both current economic outcomes and past economic processes. Differences in income arise from participation in production and factor markets, while differences in wealth reflect accumulated advantages or disadvantages over time. Because of this, inequality is a persistent feature of economic systems and cannot be understood by looking at income alone.
The Policy Objective of a More Even Distribution of Income
A more even distribution of income is often regarded as an important objective of economic policy, particularly when inequality becomes large enough to create social or economic problems. While some degree of inequality is inevitable in a market economy, concerns arise when income differences lead to hardship, social exclusion, or persistent disadvantage for certain groups within society.
One reason governments pursue a more even distribution of income is based on considerations of social justice and welfare. If large numbers of households have incomes that are insufficient to meet basic needs, living standards may fall below what is regarded as acceptable in a developed society. Individuals with low incomes may struggle to afford adequate housing, nutrition, healthcare, and education. From this perspective, redistribution is seen as a way of ensuring that all members of society achieve a minimum standard of living.
A more even income distribution may also be desirable for economic reasons. High levels of inequality can limit access to education and training for lower-income households, reducing the development of human capital. If individuals are unable to invest in their skills because of low income, the economy may fail to make full use of its potential labour resources. In this way, inequality can constrain long-run economic growth.
At the macroeconomic level, inequality may affect aggregate demand. Lower-income households tend to spend a higher proportion of their income on consumption than higher-income households, who are more likely to save. If a large share of income is concentrated among high-income groups, overall consumption demand may be weaker than it would be with a more even distribution of income. This can reduce output and employment, particularly during periods of economic slowdown.
Governments can influence the distribution of income through taxation and transfer payments. Progressive income taxes reduce post-tax income inequality by taking a higher proportion of income from higher earners. Transfer payments, such as social security benefits, provide income support to households with low or no earnings. Together, taxation and transfers can significantly alter the distribution of disposable income compared with the distribution of market income.
However, policies aimed at redistributing income involve trade-offs. High tax rates may weaken incentives to work, save, or invest, particularly if individuals perceive that additional effort yields little additional reward. Similarly, generous transfer payments may reduce incentives to seek employment in some cases. Policymakers therefore face a balance between reducing inequality and maintaining incentives that support economic efficiency and growth.
The objective of a more even distribution of income is not to eliminate inequality entirely, but to limit its extent so that it does not undermine social cohesion, economic opportunity, or long-term prosperity. For this reason, redistribution remains a central and contested issue in macroeconomic policy.
Measuring Inequality in Society
In order to analyse income inequality and assess whether it is widening or narrowing over time, it is necessary to measure how income is distributed across the population. Aggregate measures such as GDP or GNI per capita are not sufficient for this purpose because they provide only an average level of income and reveal nothing about how that income is shared among households or individuals.
One common approach to measuring inequality is to rank households according to their income, from the poorest to the richest, and then divide the population into groups. These groups are typically based on equal proportions of the population rather than equal shares of income. By examining how much income each group receives, economists can describe the pattern of income distribution in a clear and systematic way.
Households may be divided into deciles, quintiles, or quartiles. When the population is divided into ten equal-sized groups, these groups are known as deciles. The lowest decile contains the poorest ten percent of households, while the highest decile contains the richest ten percent. Quintiles divide the population into five equal-sized groups of twenty percent each, and quartiles divide the population into four equal-sized groups of twenty-five percent each. For the purposes of this level of analysis, attention is often focused on quartiles and quintiles.
Once households have been grouped in this way, the share of total income received by each group can be calculated. For example, it may be observed that the lowest quintile receives a relatively small proportion of total income, while the highest quintile receives a much larger share. Comparing these income shares provides a simple indication of inequality. A larger gap between the income share of the top group and that of the bottom group indicates a more unequal distribution.
This method of measurement also allows comparisons to be made between countries and across time. If the share of income received by the lowest groups rises over time, inequality is likely to be decreasing. Conversely, if a growing proportion of income accrues to the highest groups, inequality is increasing. However, it is important to recognise that these measures describe relative shares rather than absolute living standards. A household in the lowest quintile may still experience rising real income even if inequality is increasing.
Although grouping households in this way provides useful information, it does not capture the full picture of income distribution. It does not show how income is distributed within each group, nor does it indicate the exact distance between households at different points in the distribution. For this reason, additional tools are needed to summarise inequality more precisely and to allow clearer visual comparison. These tools include graphical representations and summary indices, which are examined in the next sections.
The Lorenz Curve
The Lorenz curve is a graphical method used to illustrate the distribution of income or wealth within a society. It provides a visual representation of inequality by showing how cumulative income is shared among cumulative proportions of the population. By comparing the actual distribution of income with a situation of complete equality, the Lorenz curve makes the extent of inequality easier to interpret.
To construct a Lorenz curve, households are first ranked from the poorest to the richest according to their income or wealth. The horizontal axis measures the cumulative percentage of the population, starting with the lowest-income households and moving progressively toward the highest-income households. The vertical axis measures the cumulative percentage of total income or wealth received by these households.
The line of perfect equality is drawn as a straight diagonal line from the origin to the top right corner of the diagram. This line represents a situation in which income is distributed evenly across the population. For example, the lowest 20 percent of households receive 20 percent of total income, the lowest 50 percent receive 50 percent, and so on. Every proportion of the population receives the same proportion of income.
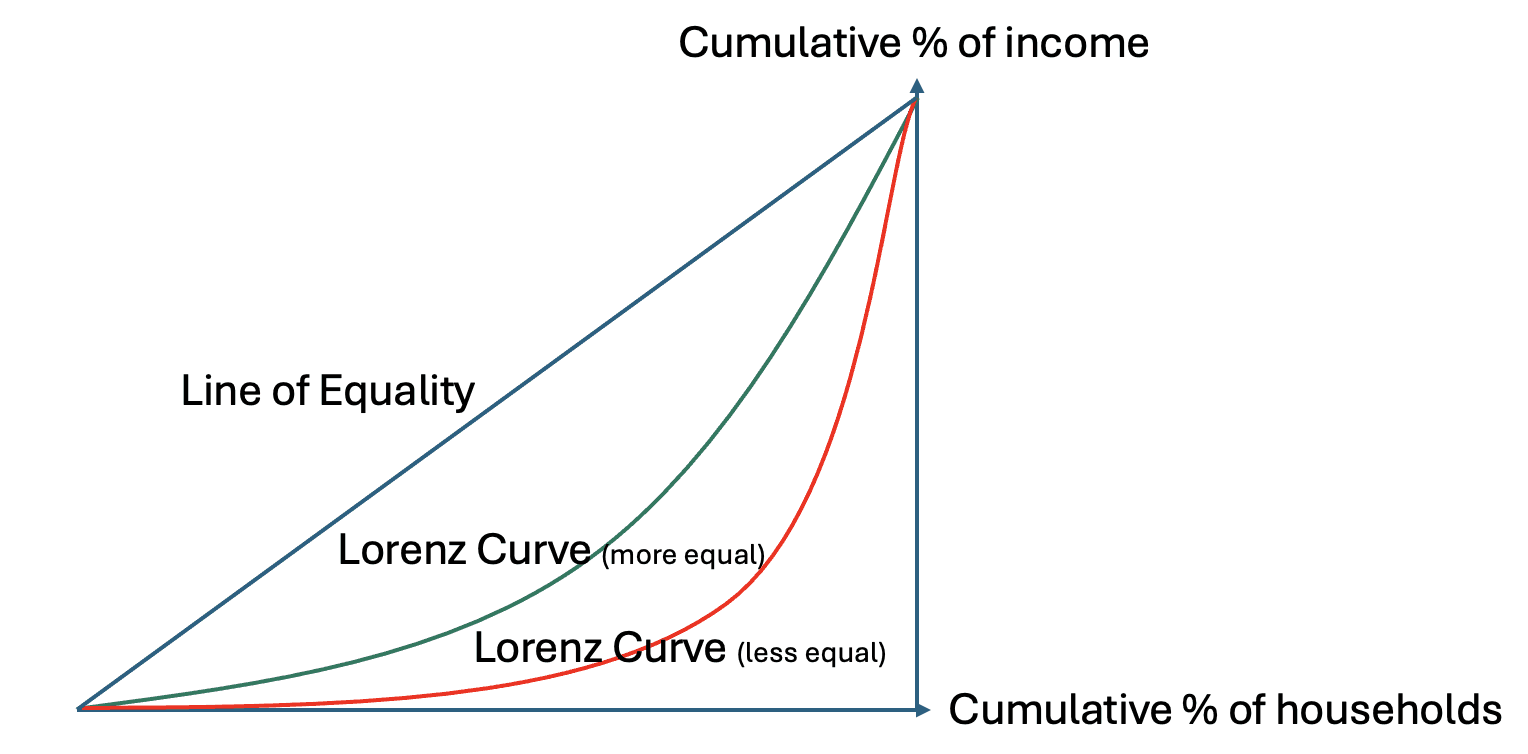
The Lorenz curve itself lies below the line of perfect equality in all societies where income is distributed unequally. At each point along the horizontal axis, the Lorenz curve shows the cumulative share of income received by the corresponding cumulative share of the population. For example, the curve may show that the poorest 40 percent of households receive only 20 percent of total income. The further the Lorenz curve lies below the line of equality, the greater the degree of inequality.
The shape of the Lorenz curve provides information about how income is distributed across different parts of the population. If the curve is relatively close to the line of equality, income is distributed more evenly. If the curve is highly bowed away from the line of equality, this indicates that a large share of income is concentrated among higher-income households. In extreme cases, a small proportion of the population may receive a very large share of total income.
The Lorenz curve can be used to compare inequality between different societies or within the same society over time. If one country’s Lorenz curve lies everywhere closer to the line of equality than another’s, it is unambiguously more equal. Similarly, if a country’s Lorenz curve shifts closer to the line of equality over time, this indicates a reduction in inequality.
The Gini Coefficient
The Gini coefficient is a numerical measure of inequality that is derived directly from the Lorenz curve. While the Lorenz curve provides a visual representation of how income or wealth is distributed, the Gini coefficient summarises this information in a single number. This makes it easier to compare inequality across countries or to track changes in inequality over time.
The Gini coefficient is calculated by comparing the area between the line of perfect equality and the Lorenz curve with the total area under the line of perfect equality. The line of perfect equality forms a right-angled triangle beneath it. The area between this line and the Lorenz curve represents the extent to which actual income distribution deviates from perfect equality. The Gini coefficient is equal to the ratio of this area to the total area under the line of equality.
The value of the Gini coefficient lies between zero and one. A value of zero represents perfect equality, where every individual or household receives exactly the same income or holds the same share of wealth. In this case, the Lorenz curve coincides with the line of perfect equality. A value of one represents extreme inequality, where all income or wealth is held by a single individual or household and the rest of the population receives nothing. In this case, the Lorenz curve lies along the horizontal axis and then rises vertically at the final point.
In practice, Gini coefficients for income distribution typically lie somewhere between these two extremes. Lower values indicate a more even distribution of income, while higher values indicate greater inequality. For example, a country with a Gini coefficient of 0.25 has a more equal income distribution than a country with a coefficient of 0.40. Changes in the Gini coefficient over time can therefore be used to assess whether inequality is increasing or decreasing.
The Gini coefficient is widely used because it provides a clear and concise summary of inequality. It allows straightforward comparison between countries and across different time periods, even when the underlying income distributions are complex. For this reason, it is frequently used by governments, international organisations, and researchers when analysing inequality and evaluating the impact of policy.
However, the Gini coefficient also has limitations. Because it compresses the entire income distribution into a single number, it does not reveal where inequality is concentrated. Two societies may have the same Gini coefficient but very different income distributions. In one case, inequality may arise mainly because of a very wealthy top group, while in another it may reflect widespread low incomes at the bottom of the distribution.
The Gini coefficient is also sensitive to changes in different parts of the income distribution in different ways. Changes affecting middle-income households may have a larger effect on the coefficient than changes affecting the very poorest or very richest groups. As a result, the Gini coefficient should not be interpreted in isolation.
Despite these limitations, the Gini coefficient remains a valuable tool for measuring inequality. When used alongside other indicators, such as income shares, poverty rates, and Lorenz curves, it helps to build a fuller picture of how income and wealth are distributed within society.
Absolute and Relative Poverty
Poverty refers to a situation in which individuals or households lack sufficient resources to achieve an acceptable standard of living. However, what constitutes poverty depends on how it is defined and measured. Two main concepts are used in economic analysis: absolute poverty and relative poverty. These concepts capture different aspects of deprivation and lead to different interpretations of living standards and welfare.
Absolute poverty refers to a situation in which income or consumption falls below a fixed minimum level required to meet basic needs. These needs typically include adequate food, shelter, clothing, and access to essential services such as clean water and basic healthcare. An absolute poverty line is set at a level intended to represent the minimum resources necessary for physical survival. Individuals or households with income below this threshold are considered to be living in absolute poverty.
Because absolute poverty is based on a fixed standard, it allows comparisons over time and across countries. If real incomes rise and fewer people fall below the absolute poverty line, absolute poverty is said to be declining. This measure is particularly important in low-income and developing economies, where a significant proportion of the population may struggle to meet basic needs. International organisations often use a common absolute poverty threshold to compare living standards across countries.
Relative poverty, by contrast, is defined in relation to the overall income distribution within a society. Individuals are considered to be living in relative poverty if their income falls significantly below the average or median income of the population. A common measure defines relative poverty as having an income below a fixed percentage of the median income. This approach reflects the idea that poverty is not only about physical survival but also about the ability to participate fully in society.
Relative poverty therefore depends on societal standards and norms. As average incomes rise, the relative poverty line also rises. This means that relative poverty can persist even when absolute living standards improve. For example, households may have access to basic necessities but still be considered poor if their income is far below that of the typical household and limits their ability to engage in social, cultural, or economic activities.
The distinction between absolute and relative poverty has important implications for policy. Reducing absolute poverty focuses on ensuring that basic needs are met, often through economic growth, employment creation, and targeted support. Reducing relative poverty involves addressing income inequality and improving access to opportunities, such as education and skills, that allow households to share more fully in overall economic prosperity.
Both concepts provide valuable information about welfare. Absolute poverty highlights extreme deprivation and threats to basic living conditions, while relative poverty highlights inequality and social exclusion within a society. For this reason, economists and policymakers often use both measures when assessing poverty and designing policies aimed at improving living standards.
Persistent Poverty
Persistent poverty refers to a situation in which individuals or households remain in poverty for an extended period of time rather than experiencing poverty temporarily. This distinction is important because short-term poverty and long-term poverty have very different causes, consequences, and policy implications. A household that experiences a brief fall in income may recover relatively quickly, while a household trapped in persistent poverty may face long-lasting disadvantages.
Persistent poverty is often defined using income data collected over several years. Individuals are considered persistently poor if their income remains below a defined poverty threshold for a sustained period. This approach recognises that a snapshot measure of poverty taken at a single point in time may underestimate the scale of deprivation faced by some households. A household may move slightly above the poverty line in one year while remaining vulnerable and experiencing hardship over a longer period.
The causes of persistent poverty are often structural rather than temporary. Long-term unemployment is a key factor. Individuals who remain out of work for extended periods may experience a deterioration of skills, reduced employability, and declining confidence. This makes it increasingly difficult to re-enter employment, reinforcing low income and poverty over time.
Low levels of education and skills also contribute to persistent poverty. Individuals with limited qualifications may be restricted to low-paid or insecure employment, with little opportunity for progression. This can result in repeated periods of unemployment or underemployment, preventing sustained income growth and increasing the likelihood of long-term poverty.
Health problems and disability can further entrench poverty. Poor health may limit an individual’s ability to work consistently or to take on higher-paying roles. At the same time, low income can restrict access to healthcare, nutritious food, and adequate housing, creating a cycle in which poverty and poor health reinforce each other.
Family structure and demographic factors can also influence persistent poverty. Households with a single earner, large numbers of dependents, or caring responsibilities may face higher risks of long-term poverty, particularly if access to affordable childcare or support services is limited. These factors can reduce labour market participation and constrain income over time.
Persistent poverty has serious implications for welfare and social mobility. Children growing up in persistently poor households may experience poorer educational outcomes, worse health, and fewer opportunities later in life. This increases the likelihood that poverty is transmitted from one generation to the next, reinforcing inequality over time.
Because persistent poverty reflects deep-rooted disadvantages, it often requires targeted and sustained policy responses. Short-term income support alone may not be sufficient. Policies aimed at improving education, skills, health, and access to stable employment play a crucial role in addressing the underlying causes of long-term poverty.
Causes of Inequality and Poverty
Inequality and poverty arise from a combination of economic, social, and structural factors. These factors influence how income and wealth are generated and distributed within the economy and help to explain why some individuals experience persistently low living standards while others accumulate high levels of income and wealth.
Conditions in the labour market are a central cause of income inequality and poverty. Employment is the main source of income for most households, so differences in access to work and in earnings from work play a crucial role. Individuals who are unemployed or underemployed receive little or no labour income and are therefore at greater risk of poverty. Even among those in work, wage differences can be substantial. Workers with low skills or limited experience are often employed in low-paid occupations, while those with higher skills and qualifications tend to earn higher wages.
Education and skills are closely linked to labour market outcomes. Individuals with higher levels of education and training are generally more productive and therefore command higher wages. By contrast, individuals with low levels of education may face restricted job opportunities and lower earnings. Differences in access to education and training can therefore reinforce income inequality over time. If children from low-income households have fewer educational opportunities, inequality may persist across generations.
Ownership of wealth is another important source of inequality. Individuals who own assets such as property, shares, or savings receive income from these assets in addition to any earnings from employment. This income from capital can significantly increase total income and allow wealth to grow further through reinvestment. Those without assets rely primarily on labour income and may struggle to build wealth, particularly if wages are low or unstable.
Demographic factors also contribute to inequality and poverty. Household composition influences income needs and earning capacity. Single-parent households, households with many dependents, or households with caring responsibilities may face higher risks of poverty, especially if labour market participation is limited. Age can also play a role, as younger and older individuals may have lower incomes than those in their prime working years.
Structural changes in the economy can increase inequality. Technological change may raise demand for skilled labour while reducing demand for low-skilled labour, widening wage differentials. Globalisation can intensify competition in some industries, leading to job losses or wage pressure in sectors exposed to international trade. Without effective adjustment mechanisms, these changes can increase inequality and poverty.
Discrimination and unequal access to opportunities can further exacerbate inequality. Barriers related to gender, ethnicity, disability, or geographic location may limit access to education, employment, or promotion. These barriers reduce earning potential and contribute to persistent income differences between groups.
Inequality and poverty therefore reflect the combined effects of labour market outcomes, education, asset ownership, demographic factors, and structural economic change. Addressing these issues requires policies that operate across multiple areas, including education, employment, taxation, and social support.
The Distribution of Wealth
The distribution of wealth refers to how the stock of assets owned within an economy is shared among individuals or households. Wealth includes property, savings, shares, bonds, pension assets, and other financial or real assets, minus any outstanding liabilities such as mortgages or loans. Unlike income, which is earned over time, wealth represents accumulated ownership at a particular point in time.
Wealth is typically distributed far more unevenly than income. In most economies, a relatively small proportion of households owns a large share of total wealth, while many households own little or no wealth at all. This reflects the cumulative nature of wealth accumulation. Individuals with higher incomes are able to save more, invest more, and benefit from compound returns over time. By contrast, households with low or unstable incomes may struggle to save and may rely on borrowing, limiting their ability to build wealth.
Inheritance plays a central role in shaping the distribution of wealth. Assets transferred from one generation to the next can give recipients a significant economic advantage. Inherited wealth can be used to purchase property, invest in financial assets, or support education and business formation. Because inheritance is unevenly distributed, it can reinforce existing wealth inequalities across generations, making wealth inequality more persistent than income inequality.
Asset price movements also influence the distribution of wealth. Rising property prices or stock market gains increase the wealth of those who already own assets, while those without asset ownership do not benefit directly. As a result, periods of strong asset price growth can widen wealth inequality even if income inequality remains unchanged.
Debt further affects wealth distribution. Some households have negative net wealth because their liabilities exceed their assets. High levels of debt can reduce financial security and limit future opportunities to accumulate wealth. Households with low or negative wealth are more vulnerable to economic shocks such as unemployment, illness, or interest rate increases.
Wealth inequality has important implications for economic opportunity and welfare. Wealth provides a buffer against income shocks and allows households to smooth consumption over time. It also enables investment in education, health, and business activity. Unequal access to wealth therefore contributes to unequal opportunities and can limit social mobility.
Because wealth inequality reflects long-term accumulation and intergenerational transfers, it is often more resistant to short-term policy measures than income inequality. Policies aimed at influencing wealth distribution may involve taxation of property, capital gains, or inheritances, as well as measures to encourage asset ownership and saving among lower-income households.
Understanding the distribution of wealth is essential for a complete analysis of inequality and welfare. Income measures alone may understate disparities in economic security and opportunity if large differences in wealth ownership exist beneath the surface.
Government Intervention
Governments play a significant role in influencing the distribution of income and wealth through a range of policy measures. These interventions are designed to reduce excessive inequality, alleviate poverty, and improve overall welfare, while balancing concerns about efficiency, incentives, and economic growth. Government intervention operates both through the tax system and through public spending and regulation.
One of the most important tools used to influence income distribution is taxation. Progressive taxation systems are designed so that higher-income individuals pay a larger proportion of their income in tax than lower-income individuals. Income taxes, in particular, can reduce inequality in disposable income by redistributing resources from higher earners to fund public services and transfer payments. Taxes on wealth, such as property taxes or taxes on capital gains, can also influence wealth distribution by reducing the accumulation of assets at the top of the distribution.
Transfer payments are another key mechanism through which governments redistribute income. These include social security benefits, unemployment benefits, pensions, and other forms of income support. Transfer payments provide income to individuals who are unemployed, retired, disabled, or otherwise unable to earn sufficient income through employment. By increasing the incomes of lower-income households, transfers reduce poverty and narrow income disparities.
Governments also intervene through the provision of public services. Spending on education, healthcare, housing, and social care can have a significant impact on welfare and inequality. Access to free or subsidised education improves opportunities for individuals from low-income households and can reduce income inequality over time by increasing skills and productivity. Similarly, publicly funded healthcare improves health outcomes and reduces financial risk for households, particularly those with low incomes.
Labour market policies also affect income distribution. Minimum wage legislation sets a floor on wages, raising the earnings of low-paid workers and reducing wage inequality at the bottom of the income distribution. Employment protection, training programs, and support for job search can improve labour market outcomes for disadvantaged groups and reduce the risk of persistent poverty.
However, government intervention involves trade-offs. High tax rates may reduce incentives to work, save, or invest, potentially affecting economic efficiency and growth. Generous benefits may reduce incentives to seek employment in some cases. Policymakers must therefore consider the potential impact of redistribution on behaviour as well as its effect on inequality and welfare.
Government intervention is not limited to reducing inequality directly. Policies that promote economic growth, stable employment, and access to opportunities also play a role in improving income distribution over time. Effective intervention seeks to balance equity and efficiency, recognising that reducing excessive inequality and supporting welfare can contribute to a more inclusive and stable economy.
Consequences of Poverty and Inequality
Poverty and inequality have wide-ranging consequences that extend beyond differences in income and wealth. They affect economic performance, social outcomes, and long-term welfare, influencing both individual life chances and the functioning of the economy as a whole. While some degree of inequality is inevitable, high or persistent levels of poverty and inequality can generate significant economic and social costs.
One important consequence of poverty is its impact on living standards and well-being. Individuals living in poverty often face inadequate housing, poor nutrition, and limited access to healthcare. These conditions can lead to worse physical and mental health outcomes, reducing quality of life and limiting individuals’ ability to participate fully in economic and social activities. Poor health, in turn, can reduce productivity and earning capacity, reinforcing low income and poverty over time.
Poverty also affects educational outcomes. Children from low-income households may have limited access to educational resources, such as books, technology, and extracurricular opportunities. They may attend under-resourced schools or face instability at home that disrupts learning. As a result, educational attainment may be lower, reducing future employment prospects and earnings. This creates a cycle in which poverty is transmitted from one generation to the next.
High levels of inequality can weaken social cohesion. Large gaps between rich and poor may lead to social exclusion, resentment, and reduced trust within society. When individuals perceive that opportunities are unfairly distributed or that economic success is unattainable for some groups, confidence in institutions and social norms may decline. This can contribute to social tension and political instability.
From an economic perspective, inequality can affect long-term growth. If access to education, healthcare, and finance is limited for lower-income groups, the economy may fail to develop its full human capital potential. Talented individuals may be unable to invest in their skills or start businesses, reducing innovation and productivity growth. In this way, inequality can lead to an inefficient allocation of resources.
Inequality can also influence aggregate demand. Lower-income households tend to spend a larger proportion of their income on consumption than higher-income households. When a large share of total income accrues to higher-income groups, overall consumption growth may be weaker, potentially reducing output and employment. This effect may be particularly significant during economic downturns.
Persistent poverty imposes fiscal costs on governments. Higher spending on benefits, healthcare, and social services may be required to support disadvantaged households. At the same time, low incomes reduce tax revenues. These fiscal pressures can limit government capacity to invest in public goods and infrastructure, affecting long-term economic performance.
The consequences of poverty and inequality therefore extend beyond individual hardship. They shape economic efficiency, social stability, and future growth prospects. Addressing poverty and inequality is not only a matter of social justice but also of economic sustainability and long-term welfare.
The Impact of Economic Growth on Inequality
Economic growth refers to an increase in an economy’s productive capacity and real output over time. Growth raises average income and living standards, but its effect on income inequality is not straightforward. Growth can either reduce or increase inequality depending on how the benefits of rising output are distributed across different groups in society.
In the early stages of economic development, growth is often associated with rising inequality. As an economy expands, new opportunities may emerge in particular sectors or regions, such as manufacturing or urban areas. Individuals who are able to access these opportunities may experience rapid income growth, while others remain employed in low-productivity activities. This can widen income gaps during periods of structural change.
Over time, continued growth may lead to a reduction in inequality. As productivity improves and more workers gain access to education, skills, and higher-paying jobs, income differences may narrow. Increased government revenue generated by growth can also allow greater spending on public services and social protection, which may reduce inequality further.
This relationship between growth and inequality is often illustrated by the Kuznets hypothesis. The Kuznets hypothesis suggests that as an economy develops, inequality first increases and then decreases, forming an inverted U-shaped relationship between income per capita and inequality. In the early stages of development, inequality rises as growth benefits a limited group. In later stages, inequality falls as growth becomes more broadly shared across society.
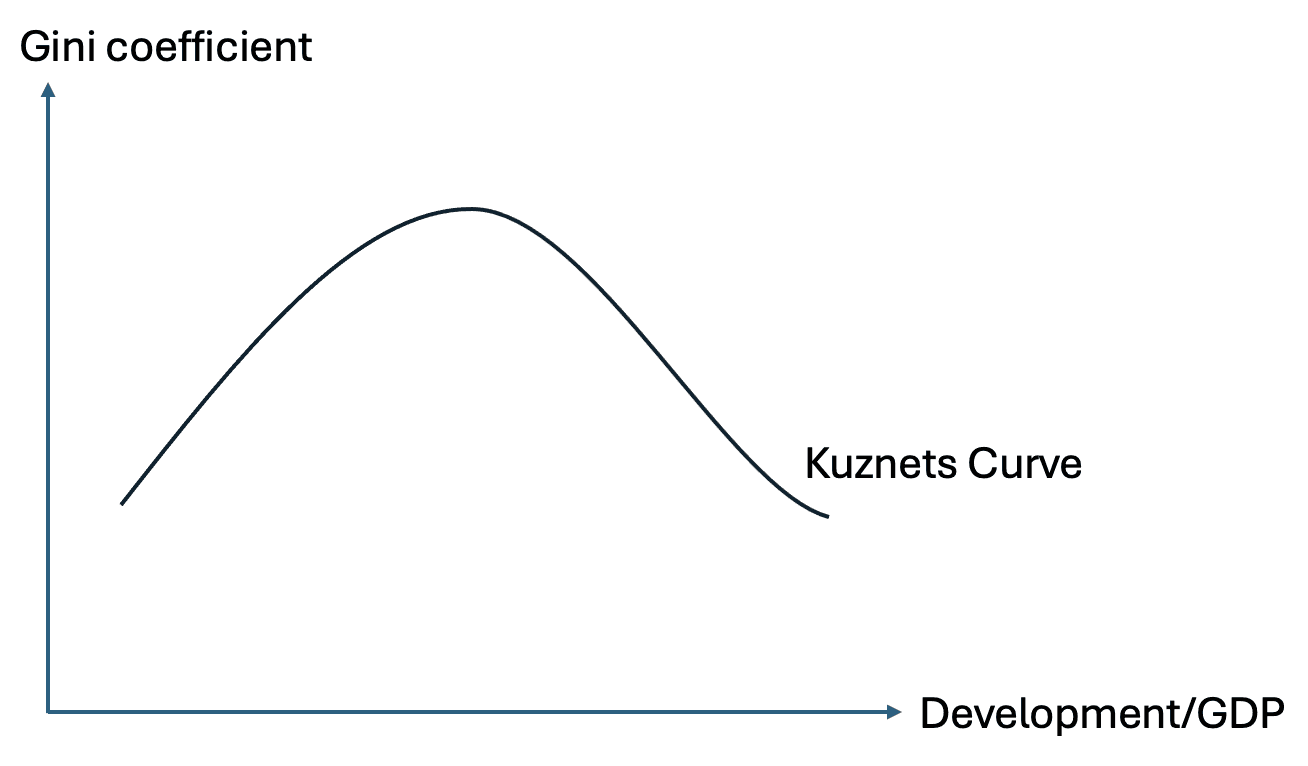
According to this view, economic growth eventually leads to improved access to education, urban employment, and social protection, which help to reduce inequality. Structural changes such as the shift from agriculture to industry and services are seen as key drivers of this process. As more workers move into higher-productivity sectors, average incomes rise and income differences narrow.
However, the relationship between growth and inequality depends heavily on institutions and policy. Growth does not automatically lead to a more even distribution of income. If access to education, employment, and capital remains uneven, growth may disproportionately benefit higher-income groups. In such cases, inequality may continue to rise even as average incomes increase.
Economic growth can therefore improve welfare without necessarily reducing inequality. Rising average income may coexist with persistent or widening income gaps. For this reason, growth alone is not sufficient to address inequality and poverty. The impact of growth on income distribution depends on how inclusive the growth process is and on the policies that shape access to opportunities and resources.

Next Article